One of the biggest news stories in the U.S. over the last few months has been the Ebola outbreak in West Africa. As a result, in part, of the sheer volume of news coverage, it has been of great concern to the U.S. populace. The concern is understandable. It is a "new-ish" (at least to most people in developed countries) disease, has a very high case fatality ratio (CFR), and currently there are limited options for treatment. Thankfully, this disease isn't easily spread from one person to another. The chance of this being a large driver of morbidity or mortality in the U.S. is very small.
However, while Ebola is unlikely to noticeably change mortality rates the Ebola outbreak can be used to think about modeling mortality in a completely different context to our historical thinking. As a general rule, mortality modeling is often thought of as a purely binary process. However callous it may sound, individuals are either alive or dead; the exact cause of death is not generally considered important. Improvements in mortality are often implemented with a simple logarithmic/geometric trending process to account for future rates and changes. Variation is often not considered.
This suggests that changes in mortality over time are relatively straight-forward and therefore extrapolation into the future is also straight-forward. Unfortunately, this isn't how it works.
Mortality improvements at times are slow and progressive; at other times, they are fast and dramatic. Understanding the latter is often as-or more-important than the former.
To highlight some of the historical changes, look at the graph below. You can see the mortality rate from each year (1979-2012) relative to the 1979 mortality for four age groups. For example, mortality for the 45-54 age group (red line) in 1987 is approximately 90% of the mortality in 1979, but approximately 60% of that in 2012.
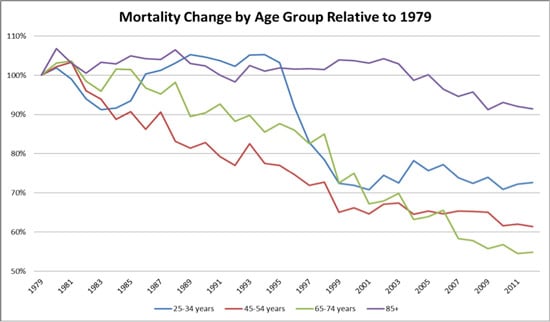
This graph highlights several key features of mortality. One of the largest shocks to mortality in the last 35 years was the HIV/AIDs pandemic of the late 1980s to mid-1990s. This event devastated the young adult population. Between 1987 and 1996, the mortality rate for 25-34 year olds (blue line) was higher than their 1979 mortality. Yes, the 25-34 year olds also experienced mortality improvements apart from the impact of HIV/AIDS, but overall they lost ground until 1996. At this point new drug treatments and awareness took hold and dramatically reduced mortality rates.
Another interesting aspect of this group is what has happened post-2000. The stability in mortality is again an aspect of offsetting affects, namely an increase in self-inflicted harm and a decrease in medical and accident related rates of death.
As we can see, some mortality impacts, such as those for 65-74 year olds, are slow and progressive while others, for 25-34 year olds for example, are unexpected and dramatic. Often in many cases both sets of changes occur simultaneously. The subsequent result on overall mortality is an interaction between the competing causes of death.
Having the ability to address both kinds of changes and understanding the major drivers allows us to react appropriately to changes and model the uncertainty. What is most apparent is the need to remove blanket statements and assumptions in mortality and to learn from its dynamic nature. This will result in a better understanding and modeling of mortality, which should result in improved financials.