
Katrina 2015
Aug 26, 2015
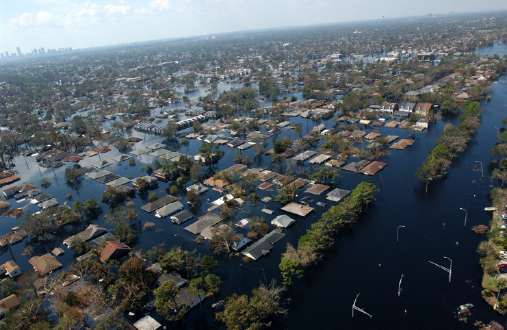
Editor's Note: Hurricane Katrina—the most costly natural disaster ever faced by the insurance industry—struck the United States 10 years ago this month, causing extensive storm surge damage along the Gulf Coast and the inundation of most of New Orleans. Although billions have been spent on storm surge defenses in the New Orleans area, the risk of a catastrophic storm surge remains.
What if a storm with the intensity, size, and track of 2005's Hurricane Katrina again struck the Gulf Coast near New Orleans? Given today's exposures and with enhanced flood defenses for New Orleans, what levels of damage could be expected?
In this 10-year anniversary look back—and forward—at Katrina, we follow the storm as it tracks across Southern Florida, intensifies over warm Gulf of Mexico waters, abruptly turns north toward Louisiana and Mississippi, and, on August 29, 2005, makes landfall on the Gulf Coast. We then review Katrina's aftermath: the immediate impact of the storm's wind and storm surge and the subsequent rebuilding of the flood defense system for New Orleans.
Finally, we use AIR's U.S. hurricane model—which includes a new hydrodynamic storm surge component—to model two scenarios for Hurricane Katrina's landfalls along the Gulf Coast with today's exposure. In the first scenario, we estimate potential insured gross loss and ground-up loss assuming widespread failure in the new, multibillion-dollar New Orleans flood defense system. In the second scenario, we estimate losses under the assumption that the extensive flood defense system holds.
 By: Dr. Sylvie Lorsolo
Scientist
 By: Dr. Karthik Ramanathan
Senior Engineer
Edited by Dan Edson
The article: - Hurricane Katrina was the worst natural disaster the insurance industry has faced, with total insured payouts of more than USD 41 billion.
- Post Katrina the USACE built a USD 14 billion storm surge defense network for New Orleans.
- New Orleans again would experience widespread flooding from a Katrina-type storm if flood defenses fail.
- Insurance coverage for wind far exceeds coverage for flooding, including storm surge.
Hurricane Katrina's 2005 Gulf Coast Landfalls
Storm Track
The tropical disturbance that would become the last Atlantic hurricane ever to be named Katrina was upgraded to a tropical depression on August 23, 2005, a couple of hundred miles south of Nassau in the Bahamas.1 It gained hurricane strength shortly before making landfall the evening of August 25, between Miami and Fort Lauderdale (see Figure 2).
Hurricane Katrina proceeded west across Florida as a weak Category 1 storm, with 80 mph winds, leaving in its wake moderate building damage, numerous power outages, and up to 15 inches of rain in some locations. Katrina lost strength while traversing the state and entered the eastern Gulf of Mexico on August 26 as a tropical storm.
For the next two days, Hurricane Katrina rapidly intensified as it moved in a clockwise arc over the warm Gulf waters and, in particular, over the Loop Current. By August 28, Katrina had grown into a massive, Category 5 hurricane, with maximum winds approaching 175 mph, hurricane-strength winds extending more than 100 miles from the eye, and a central pressure of 902 mb.2 As it entered shallower water over the broad continental shelf, storm surge began to pile up.
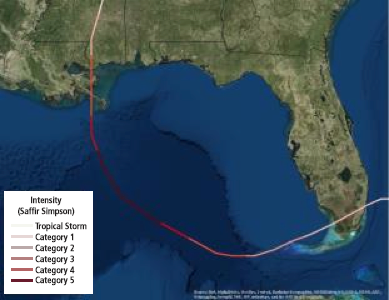
A little past daybreak on August 29—roughly three days after exiting South Florida—Hurricane Katrina made landfall near the small town of Buras, Louisiana, in the islands at the mouth of the Mississippi River, as a Category 3 hurricane with 125 mph winds. A few hours later, with winds down to 120 mph, Hurricane Katrina made its second Gulf Coast landfall, near the border of Louisiana and Mississippi.
The Mississippi coast received the brunt of the storm at landfall, with major damage occurring in Bay St. Louis, Gulfport, and Biloxi. The massive storm continued to track north and eventually dissipated, with a damage footprint that reached east across Mississippi into Alabama and Florida and north to Tennessee.
Impact
Hurricane Katrina caused widespread wind and storm surge damage in Louisiana and Mississippi. Cities and towns were flooded, bridges were severely damaged, residential, commercial, and industrial property was ravaged, hundreds of thousands of people were displaced, and nearly 2,000 people died as a result of the storm.3 Many communities throughout the region became isolated by the widespread flooding, with relief efforts severely hampered by the debilitating impact of the storm on coastal infrastructure.
Although newer buildings in Louisiana and Mississippi fared better than older ones, they didn't fare as well as their Floridian counterparts, which had stringent building codes in place. Mississippi had no statewide codes in place at the time of the hurricane. In 2004, Louisiana had adopted the 2000 International Building Code, which requires that commercial buildings be designed to resist sustained 120 mph winds. Due to its quite recent adoption, however, many structures in New Orleans did not comply with this standard. Poor construction materials and their deterioration with time, along and the relative rarity of mitigation measures, led to significant wind damage.
Indeed, it is easy to forget the widespread wind damage in New Orleans, most of it to exterior glazing, and much of it caused by windborne debris. In discussions with contractors charged with repairing these buildings, AIR damage surveyors learned that the interiors of many high-rise structures were littered with small stones from the gravel ballast of neighboring roofs.
Still, Hurricane Katrina's extreme storm surge was to blame for most of the death and destruction from the storm. All along the coasts of Louisiana, Mississippi, Alabama, and even the Florida Panhandle, bays, inlets, rivers, bayous, and backwater swelled from the surge. Flooding from storm surge reached almost 30 feet in some locations along the Mississippi coast, and 10–20 feet on the southeastern Louisiana coast. On the coast of Alabama, surge waters were pushed up into Mobile Bay, where many high-value homes were engulfed. In addition, the oil industry in the Gulf of Mexico was severely impacted, with Katrina reducing production by 95%.
Surge damage was observed for a wide majority of buildings within the surge footprint of the hurricane. According to official counts, nearly 90% of structures located within a half mile of the affected coastline were destroyed. Insufficient elevation of homes and lack of pile foundations/stilts drove the extensive residential damage. The presence of numerous casinos and resorts on the waters along the coast of Mississippi led to widespread commercial losses. Hurricane Katrina demonstrated that loss caused by storm surge can be a significant proportion of the total loss, and that surge levels can be higher than the storm's landfall intensity would otherwise dictate.
New Orleans—about 25 miles west of the eye—escaped the direct hit forecast the day before landfall and initially appeared even to have escaped substantial damage from the storm. Katrina's storm surge, however, elevated the water level in Lake Pontchartrain on the north side of the city, swamped communities and wetlands unprotected by levees, drove water into the Intercoastal Waterway on the east and the Mississippi River on the south, filled canals throughout the area, and ultimately thoroughly overpowered the New Orleans Hurricane Protection System (HPS)—the flood defense system in place at that time. Many levees were overtopped, more than 50 levees were breached, and floodgates failed, allowing torrents of floodwater to pour into the low-lying city. With pumping stations rendered useless by power outages, the water had no place to go, and eventually as much as 80% of the city was inundated, with floodwater reaching 20 feet in some locations.
Katrina's Aftermath
The Cost
As one of the most devastating hurricanes in U.S. history and the most destructive of the major hurricanes landfalling in the United States between in 2004 and 2005, Hurricane Katrina became the worst natural disaster the insurance industry has confronted. The National Hurricane Center estimated that the New Orleans area and Mississippi coast suffered USD 75 billion in storm damage. The Federal Emergency Management Agency's National Flood Insurance Program had USD 16.3 billion in paid losses from flood and surge-related damages, bankrupting the program.
Property Claim Services (PCS) estimated total insured payouts at more than USD 41 billion in six states—Alabama, Florida, Georgia, Louisiana, Mississippi, and Tennessee—with payouts for Louisiana and Mississippi, the most heavily damaged states, pegged at USD 25.4 billion and USD 13.8 billion, respectively.4 According to PCS, more than 1.7 million claims were filed: almost a million from Louisiana and a half million from Mississippi.
Market forces generally ensure that the availability of materials and labor in any particular geographical area is sufficient to accommodate a normal level of demand without affecting price. If demand increases sharply and unexpectedly—as after a catastrophe event—the pressure on resources can cause prices to inflate temporarily. Interestingly, however, the labor price index time series for the third and fourth quarters of 2005 in Louisiana and Mississippi did not show the large increases that might have been expected from the record-breaking losses of Hurricane Katrina. A major factor was the slow pace of rebuilding in Louisiana, particularly in Orleans parish, where the majority of the losses were incurred. Because of the flooding and the displacement of so many people, and because of impending litigation over what would be covered, there was no rush to rebuild, and therefore the demand on labor resources was spread out over a much longer period of time than might otherwise be expected from such a large event.
Ultimately, though, the damage and resultant losses from Hurricane Katrina were exacerbated by the extended time that properties remained flooded. Long-term exposure to stagnant floodwater, often polluted with sewage and toxic materials, was particularly severe in New Orleans, where weeks elapsed before some sections of the city could even begin to dry out. Mold became a serious health issue and an insurance nightmare.
Investment in Flood Defenses
Within months of Hurricane Katrina, the U.S. Army Corps of Engineers (USACE) set up the Interagency Performance Evaluation Task Force (IPET) to conduct an intensive and extensive engineering review of HPS, its status, how it functioned, and the consequences of Katrina's storm surge on the system. Subsequently, USACE oversaw the design and construction of a comprehensive, USD 14.5 billion storm surge defense network in and around New Orleans, comprising 350 miles of levees and floodwalls, 73 pumping stations, five canal closures, and four gated outlets, for mitigating flooding in the city proper, as well as in vulnerable coastal land areas. Most of the levees in the new Hurricane Storm Damage Risk Reduction System (HSDRRS) were designed to prevent overtopping from hurricane storm surges up to water levels with a return period of 100 years, however design criteria may provide protection for 100-, 250-, and 300-year return periods, depending on the location of a levee and the imposed flood forces.
The IPET study and the resulting HSDRRS—in place since 2011—have lowered the risk of loss of life and property damage from flood in New Orleans. No flood defense system is foolproof, however, and depending on the circumstances, pumping systems might not be able to keep up, some levees will experience overtopping, and low-lying areas in and around New Orleans could again experience flooding.5
Statewide Adoption of Building Codes
Louisiana has taken commendable steps toward adoption of standards that make buildings more likely to survive hurricanes. The Louisiana State Uniform Construction Code (LSUCC), which is based on the 2006 edition of the International Building Code (IBC) and the International Residential Code (IRC), mandates enforcement through building officials, plan reviewers, and inspectors, although effective code enforcement has been lacking.6
Mississippi created the Mississippi Building Code Council in 2006, with the responsibility of adopting the 2003 editions of IBC and IRC. The same year, the state legislation required the adoption and enforcement of wind and flood provisions in three coastal counties—Jackson, Hancock, and Harrison—plus two adjacent counties—Pearl River and Stone. Two other inland counties—Forrest and Lamar—followed suit a year later. The level of enforcement in the remaining counties in the state of Mississippi is very low, however, and the state has fallen short by failing to adopt upgrades to the code.
What If Katrina Hit the Gulf Coast Today?
Much has changed along the vulnerable Gulf Coast since Hurricane Katrina devastated the landscape from Southern Louisiana to the Florida Panhandle. Exposure growth in the Gulf Coast region, as elsewhere, has been limited in the last decade, in part because of the great recession of 2008-2009. In Louisiana and Mississippi, the insured value of coastal property has not increased as much as the insured value of property statewide since Hurricane Katrina, but the difference in percent increases is not dramatic, as shown in Table 1. (See "The Growing Value of U.S. Coastal Property at Risk.")
Table 1. Estimated increase in insured value of property in Louisiana and Mississippi between 2004 and 2012. (Source: AIR)
| Insured Value of Property (USD billions) | ||||||
|---|---|---|---|---|---|---|
| Statewide | Coastal | |||||
| 2004 | 2012 | % Change | 2004 | 2012 | % Change | |
| Louisiana | 551.7 | 823.0 | 49 | 209.3 | 293.5 | 40 |
| Mississippi | 331.4 | 468.5 | 41 | 44.7 | 60.6 | 36 |
Much new coastal construction enjoys increased resilience to hurricane wind and storm surge, while in and around New Orleans the complex multibillion-dollar flood protection system has lowered the risk of flooding for the low-lying city. Risk of substantial storm damage remains, however, and a hurricane with the intensity, size, and track of 2005 Hurricane Katrina still could be deadly and destructive.
Using the AIR Hurricane Model for the United States, we bring a Hurricane Katrina ashore again in two scenarios: the first with catastrophic failure in the flood defense system, the second with the new flood defenses holding. The losses reported use AIR's high-resolution industry exposure database (IED) and reflect 2014 exposures. The modeled results are enabled by the new hydrodynamic storm surge component of the U.S. hurricane model, which explicitly accounts for the current New Orleans flood protection system and probabilistic failure scenarios for the system.7
Scenario 1: Flood Defenses Fail
Regardless of the engineering advancements reflected in the strengthened hurricane and storm surge risk reduction system built in and around New Orleans since Hurricane Katrina, the total elimination of risk is not possible. Knowing the insured gross loss and ground-up loss to all properties that might be expected if a Katrina-like storm were to strike today, given current exposures and failure of the upgraded levee system, is powerful information for risk management.8
As shown in Figure 3, in this flood defense failure scenario, the city of New Orleans again would experience widespread flooding, with infiltration from Lake Pontchartrain from the north, the Intercoastal Waterway from the east, and the Mississippi River from the south. Lakeside neighborhoods and much of the downtown, as well as low-lying neighborhoods east of the river—such as Arabi, Chalmette, Meraux, and Violet—again would be impacted, some quite severely.
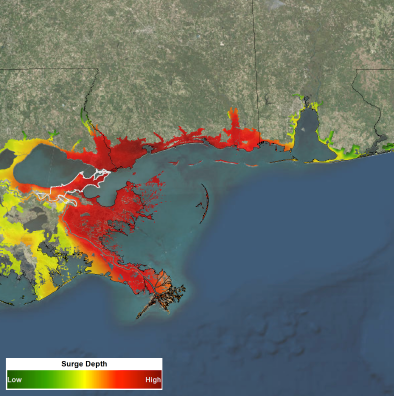
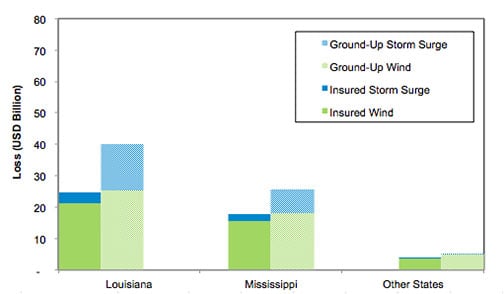
Figure 4 shows a state-level comparison of modeled insured losses and ground-up losses, by wind and storm surge. AIR's default storm surge contributions by line of business were used for the insured loss estimates, while the ground-up loss estimates account for 100% storm surge contribution across all lines of business.
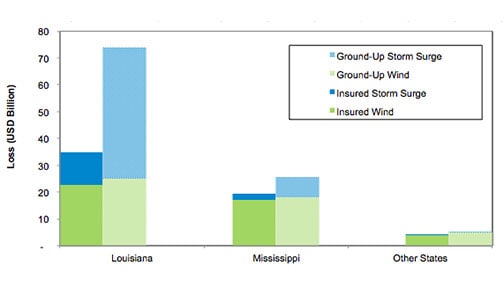
As shown in Figure 4, surge losses exceed wind losses in Louisiana from an insurable loss perspective, demonstrating the catastrophic damage potential of storm surge. However, insurance coverage for wind far exceeds that from flooding (including storm surge), which is why wind typically dominates from an insured loss perspective.
The significant growth in coastal exposure in Louisiana and Mississippi in recent years (see Table 1), coupled with subsidence in some of the areas around New Orleans and the high vulnerability of the Louisiana and Mississippi coastlines to storm surge, leads to a USD 59 billion insured loss total with flood defenses failing. This sum corresponds to a USD 105 billion ground-up loss, with Louisiana taking the lion's share in this overall loss.
Scenario 2: Flood Defenses Hold
With construction of the robust Hurricane and Storm Surge Damage Risk Reduction System (HSSDRR), New Orleans enjoys a significantly reduced risk of flooding from a severe event, even from storms more intense than Katrina was at landfall. This scenario looks at the impact of Hurricane Katrina striking New Orleans with HSSDRR holding. AIR's high-resolution hydrodynamic surge model reveals that the water levels in this simulated event remain well below levee heights and, as shown in Figure 5, the city is largely protected from flooding.
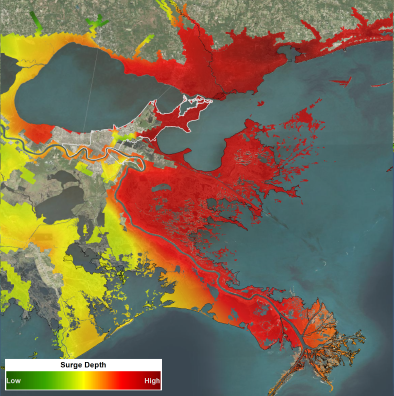
Figure 6 shows a state-level comparison of modeled insured loss and ground-up loss by wind and surge. As with Figure 4, AIR's default storm surge contributions by line of business were used for the insured loss estimates, while the ground-up loss estimates account for 100% storm surge contribution across all lines of business.
This scenario leads to a USD 46 billion insured loss, with a corresponding USD 71 billion ground-up loss. Louisiana continues to suffer the highest losses in this scenario, although with storm surge defenses holding the insured loss total for Louisiana drops 29% from the first scenario—a decrease almost entirely based on the reduction in storm surge damage in the New Orleans area. However, in both scenarios, the loss estimates in coastal Louisiana (outside the city), Mississippi, and other impacted states are very similar.
This scenario also underscores that wind is still the primary driver of insured loss, regardless of levee failure. Although the flood defense system can significantly mitigate storm surge damage in and around New Orleans area, it cannot mitigate wind damage. Attention to wind mitigation strategies remains critical.
Conclusion
One of the most powerful storms to strike the U.S. Gulf Coast, Hurricane Katrina was a landmark event that has provoked a new awareness in risk estimation and risk management, with numerous implications for the insurance and reinsurance industries—as well as for catastrophe modelers. The storm redefined the concept of a modern megadisaster, not only as a result of the physical damage from wind and water, but also because of the complexity of the insurance issues that arose, including claims handling, demand surge, and flood insurance coverage. Moreover, Katrina highlighted the effects of a large system-level failure, led to enhanced focus on the quality of exposure data, and increased the focus on business interruption and contingent business interruption exposures, all of which have spurred advances in the science of modeling wind and storm surge. Overall—as the simulations presented here illustrate—Hurricane Katina validated the importance of modeling for improving risk management.
Footnotes
1 The name "Katrina" and four other 2005 hurricane names—"Dennis," "Rita," "Stan," and "Wilma"—have been retired by the World Meteorological Organization.
2 At that time the fourth lowest central pressure on record for the Atlantic Basin.
3 Fatalities attributed to Hurricane Katrina vary widely. The National Hurricane Center estimates that 1,000 people in Louisiana and 200 in Mississippi lost their lives. The Louisiana Department of Health estimates that 1,500 people died in that state alone.
4 The PCS estimate "does not include loss involving uninsured property, including uninsured publicly owned property and utilities, agriculture, aircraft, ocean marine including oil-drilling platforms and property insured under the National Flood Insurance Program or the Write-Your-Own Program."
5 According to the USACE, four-year-old HSDRRS will undergo a "complete reanalysis" in 2017 and 2018.
6IBC and IRC were created under the auspices of the International Code Council (ICC).
7 For each levee, there is a probability that it will fail at loads below and above the given standard. Overtopping without system failure also is automatically accounted for in the model.
8 "Insured gross loss" refers to losses to insured property, after the application of policy conditions; "ground-up loss" refers to losses to insurable property, whether or not actually insured, before the application of policy conditions."
References
Munich RE, 2015. "Katrina: Ten Years After," Topics Schadenspiegel (January), pp. 26-27.
National Hurricane Center (NHC), 2013. "Hurricanes in History" web page (May 30): http://www.nhc.noaa.gov/outreach/history/#katrina (accessed July 29, 2015).
Property Claims Services (PCS), 2007. "Catastrophe Serial No. 49—Final Estimate of Insured Property Damage," Catastrophe Bulletin August 15-30, 2005 (August 8).
Schleifstein, Mark, 2013. "Upgraded Metro New Orleans Levees Will Greatly Reduce Flooding, Even in 500-Year Storms," Times-Picayune (August 16): http://www.nola.com/hurricane/index.ssf/2013/08/upgrated_metro_new_orleans_lev.html (accessed December 22, 2014).
Schleifstein, Mark, 2015. "New Orleans Area Hurricane Levee Designs Should Be Reanalyzed by 2018, Corps of Engineers Says," Times-Picayune (August 16): https://www.nola.com/news/environment/article_f65d2c7a-9f0e-5105-aaa1-321cad0eb3aa.html (accessed January 16).
U.S. Army Corps of Engineers, 2010. "Inner Harbor Navigation Canal Surge Barrier" (October): http://www2.mvn.usace.army.mil/pd/projectslist/home.asp?projectID=300 (accessed August 17, 2015).
U.S. Army Corps of Engineers, 2013. "Greater New Orleans Hurricane and Storm Damage Risk Reduction System (HSDRRS)" (June): http://www.mvn.usace.army.mil/portals/56/docs/HSDRRS/Staus-Map-2013-Pg2.jpg (accessed December 31, 2014).