
Preview of the 2018 Atlantic Hurricane Season
Jun 26, 2018
Editor's Note: There is general agreement among the forecasts for this year’s Atlantic hurricane season that activity is likely to be average, or slightly above average. But while seasonal forecasts provide a general indication of what may happen, they are far from infallible. Last year’s forecasts for slightly above-average activity were generally on point, except for the spectacularly active month of September—thanks to which 2017 saw record-breaking insured losses.
Last year’s Atlantic hurricane season was particularly memorable: 10 consecutive tropical cyclones all developed into full-blown hurricanes; there was a dramatic end to the drought of U.S. major (Category 3 or higher) hurricane landfalls; and the peak of the season in late August and September was spectacularly active. Many communities, particularly in Puerto Rico and Texas, are still struggling to recover from last year’s hurricanes. As a whole, the season was the seventh most active on record, garnered the highest Accumulated Cyclone Energy (ACE) score since 2005, and incurred record accumulated losses. Are we in for a repeat performance this year, or something entirely different?
Pre-Season Forecasts
Several bodies release seasonal forecasts, and the first of these appears as early as December of the preceding year, with the majority published in the spring. This year, there is general agreement among the forecasts that activity is likely to be average or slightly above average.
The 30-year climatological average (1981-2010) calls for 12 named storms, 6 hurricanes, and three major hurricanes to form each year. Forecasters at the National Oceanic and Atmospheric Administration (NOAA) predict a 40% chance of a near-normal season in 2018, a 35% chance that it will be above normal, and a 25% chance that it will be below normal. The seasonal hurricane predictions, aggregated by the Barcelona Supercomputing Center and Colorado State University (CSU) in association with XL Catlin, currently indicate a 70% likelihood of there being 11–17 named storms, 5–9 hurricanes, and 2–5 major hurricanes. In line with these figures, CSU expects this year’s ACE score to be slightly below its long-term average.
| Source | Named Storms | Hurricanes | Major Hurricanes |
|---|---|---|---|
| NOAA | 10-16 | 5-9 | 1-4 |
| University College London | 15 | 7 | 3 |
| Colorado State University | 14 | 7 | 3 |
| Weather.com | 13 | 7 | 2 |
| North Carolina State University | 14-18 | 7-11 | 3-5 |
| AccuWeather | 12-15 | 6-8 | 3-5 |
| Climatological Average (NOAA) | 12.1 | 6.4 | 2.7 |
 Eric Uhlhorn, Ph.D.
Manager, Principal Scientist
Edited by Jonathan Kinghorn, CEEM
The article:
• The principal factors influencing this year’s forecasts are the near-average sea surface temperatures across the tropical Atlantic Ocean and Caribbean Sea and the possibility of a weak El Niño developing.
• The atmosphere-ocean system is highly complex, so it is extremely difficult to predict far in advance how the various indicators will play out and interact.
• In any given season, there is no strong correlation between the number of hurricanes generated in the Atlantic and how many make landfall in the U.S., nor what level of losses will be incurred as a result.
Tropical Cyclone Activity Predictors
There are several elements essential for tropical cyclone (TC) formation:
- Sea surface temperatures (SST) of at least 26° C (78.8° F)
- Weak vertical wind shear, allowing deep vertical clouds to develop
- Some degree of instability in the atmosphere
- High moisture content from the ocean surface up to at least the mid-levels of the atmosphere
- Location of developing TC far enough away from the equator for the Coriolis force to impart spin
Meteorologists typically use some combination of these indicators to develop their seasonal forecasts. However, the atmosphere-ocean system is highly complex, so it is extremely difficult to predict far in advance how the various indicators will play out and interact. For this reason, some forecasters issue updates as the season develops. The principal factors influencing this year’s forecasts are the near-average sea surface temperatures across the eastern Atlantic Main Development Region (MDR) and the possibility of a weak El Niño developing.
Sea Surface Temperatures
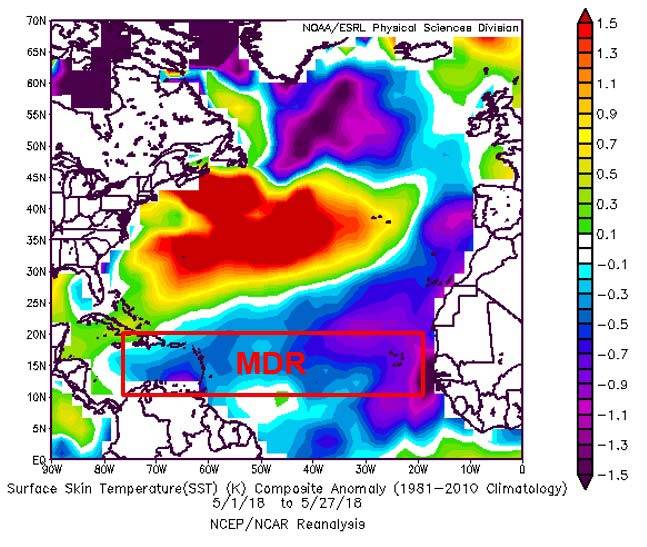
While sea surface temperatures in the western tropical Atlantic are anomalously warm, those in the eastern Atlantic are below average. This is likely to hinder hurricane development until temperatures in the MDR climb, as they are likely to do as the heart of the season approaches in August. This suggests diminished or average seasonal activity.
The Atlantic Multidecadal Oscillation (AMO)—a natural variability of SST and sea-level pressure fields in the North Atlantic—is another major factor influencing hurricane activity. Alternate periods of warm and cool SST anomalies, typically lasting 20 to 30 years, occur from the equator to Greenland. Warm periods correlate with increased tropical cyclone frequency in the basin and cool periods with lower activity. Since the mid-1990s, we have been in a warm phase and, in fact, the AMO remains above average, suggesting elevated seasonal activity.
One of the most important factors influencing tropical cyclone development is the El Niño/La Niña–Southern Oscillation (ENSO), a periodic fluctuation of SSTs and air pressure in the equatorial Pacific Ocean that can have a significant impact upon the world’s weather systems. A period with elevated SSTs in the eastern or central part of that basin is known as El Niño; it tends to increase the number of tropical cyclones in the eastern Pacific, but it also increases vertical wind shear in the Atlantic, tempering tropical cyclone formation in the MDR. Conversely, periods of cool SSTs known as La Niña have mostly the opposite effects.
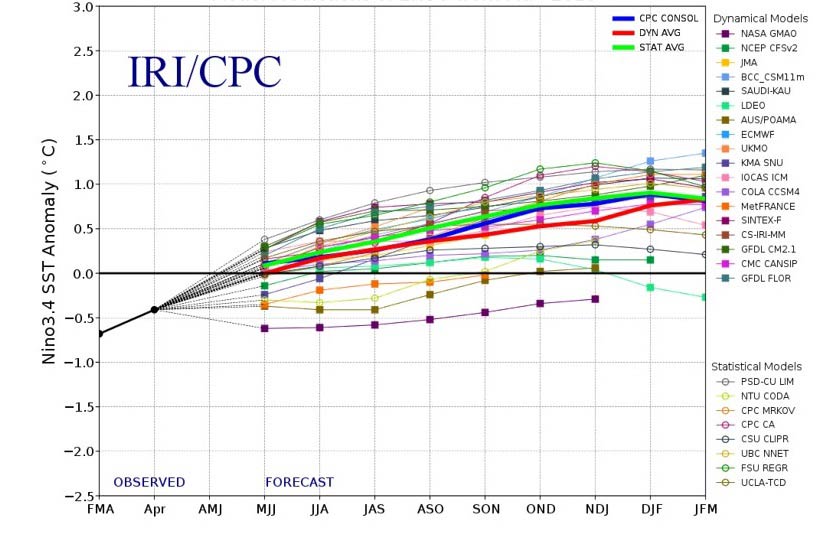
As Figure 3 shows, most models are forecasting largely neutral to mild El Niño conditions through the summer, with a strengthening El Niño in the fall. A mild El Niño coupled with a lower AMO index, should that develop, would indicate less activity.
However, ENSO conditions are not easy to predict. Indeed, last year the forecast of a strong El Niño proved spectacularly wrong; mild to neutral conditions developed instead of the expected El Niño, heralding September’s surge in hurricane activity.
Other Indicators
There are many other factors that may, or may not, influence this year’s hurricane activity, but none can be reliably forecast more than a few weeks out—and some less than that. These include the Saharan Air Layer, the Madden-Julian Oscillation, the Thermohaline Circulation, and the North Atlantic Oscillation. The North Atlantic Oscillation (NAO), for example, influences the position and strength of the Bermuda High and hence the tracks of storms across the North Atlantic through fluctuations in the strength of the Icelandic Low and the Azores High. Current forecasts are for the NAO to trend slightly positive through much of the spring, which would decrease the chances of landfalls along the U.S. Atlantic coast. But the NAO is highly variable and even with a physical understanding of the processes by which the NAO and other climate signals influence activity, developing a seasonal forecast with real skill based on them remains extremely challenging.
So, What Can We Expect?
Although scientists understand the links between the phenomena we have been discussing and hurricane formation, the inherent randomness and variability of hurricane formation and tracking toward landfall is much greater than the influence of all these factors put together on landfall risk. Even perfectly accurate SST forecasts, for example, would not make landfall risk more predictable, given the current state of knowledge.
By convention, the Atlantic hurricane season begins June 1 and ends November 30, but these dates describe only when most tropical cyclones form; storms can—and occasionally do—develop earlier or later in the year. The first storm of 2018 to achieve named status, Alberto, did so on May 28, slightly ahead of the official season, and the last three years have also seen pre-season named storms. Furthermore, regardless of whether the forecast storm counts are above or below average or the season is long or short, there is no strong correlation between the number of storms or hurricanes that form and the number of U.S. landfalls.
Multiple landfalls by a series of major hurricanes, as experienced in 2017, will almost inevitably result in catastrophic losses, but a sequence of tropical storms and lesser hurricanes (including bypassing systems) can have as much cumulative impact on the insurance industry as one or two major hurricanes. And in an otherwise quiet season, just one significant storm can cause record losses for the year, particularly if it moves slowly and triggers widespread flooding rainfall.
Seasonal forecasts provide a general indication of what may happen, but it is only as events unfold that their actual impact is revealed. Last year saw record-breaking insured losses, almost entirely because of the catastrophic hurricanes experienced around the peak of the season. When we wrote our seasonal preview, however, this extreme activity could not have been forecast. We noted merely that “while the forecasts for 2017 vary in detail, the most recent are in general agreement that the Atlantic is likely to experience slightly above-average activity this year.” The seasonal forecasts for 2018 are saying almost exactly the same thing now.
The experience of recent years has reaffirmed that high variability in year-to-year hurricane losses should be expected. Indeed the one certainty is uncertainty, and as ever with hurricanes, it pays to expect the unexpected.