
The Great Flood of 1993: Can Catastrophic Flood Risk Be Better Managed?
Aug 27, 2018
Editor's Note: This year marks the 25th anniversary of the Great Flood of 1993, which remains one of the costliest floods in U.S. history. In this article, we explain what made the flood particularly severe from both a meteorological and flood defense standpoint, put the event in the context of U.S. flood risk using the AIR Inland Flood Model for the United States, and discuss lessons learned and remaining challenges.
The Great Flood of 1993 affected nine Midwestern states—North Dakota, South Dakota, Minnesota, Wisconsin, Nebraska, Iowa, Illinois, Kansas, and Missouri—and an area of about 20 million acres. Flooding started in April and continued until September; many levees were breached after being weakened by constant pressure from rising water levels. Forty-seven people lost their lives, some 50,000 homes were damaged or destroyed, and more than 75 small towns near the rivers were completely inundated for weeks. Drinking water became scarce due to contamination and failure of septic systems, while wastewater treatment plants were shut down. Chemical spills were transported over large areas and reached alluvial aquifers. Both the Mississippi and the Missouri rivers were closed to water traffic for up to two months, causing severe business interruption losses. Ten airports suffered severe flooding and virtually all railroads in the Midwest were shut down. Bridges along the Mississippi between Davenport, Iowa, and St. Louis were closed. Total direct damage was estimated to be more than USD 15 billion (1993 dollars; source: National Weather Service). Large parts of the nine impacted states were federally declared disaster areas and as many as 500 counties received federal assistance.
Twenty-five years later, the Great Flood of 1993 remains one of the costliest floods in U.S. history.
How the Flood Unfolded
The meteorological roots for the Great Flood of 1993 were established in the fall of 1992 (see Figure 1). Above average rainfall across Missouri and the Upper Mississippi River basin resulted in above average soil moisture and reservoir levels across the region. From the winter of 1992 to the spring of 1993, a strong trough across the Pacific basin was enhanced by a subtropical jet stream across the Midwest, providing an influx of moisture supply to the already saturated grounds. As a result, that summer a nearly continuous rainfall pattern set up across the region as a strong zonal flow incessantly moved convective complexes across the Midwest.
More than 18 inches of rainfall occurred from June to August, with values peaking near 24 to 38 inches in Iowa, Minnesota, and Nebraska; these totals were more than 200 to 350% of the average. The most problematic aspect of the event was the near daily or continual rainfall that occurred across the Great Plains; most regions received rainfall on more than 20 days in July, nearly 2 to 3 times the climatology of 8-9 days. In fact, there were measurable rainfall totals across the Upper Mississippi River basin every day from late June to late July.
Flooding started on rivers in the counties of Minnesota and Wisconsin and eventually reached the Mississippi River, which crested at Clinton on July 7 at about 22.87 feet and at Keokuk on July 10 at about 27.58 feet. The Missouri River crested at Kansas City on July 27 at about 48.87 feet. This crest moved down the Missouri River, setting new records at Waverly, Boonville, Jefferson City, and Herman. The record flood stage of the Missouri River combined with the flood stage of the Mississippi River caused a record crest of the Mississippi River at St. Louis on August 1 of 49.58 feet with a record flow of 1,080,000 cubic feet per second—approximately six times the normal flow and over 9 feet above the major flooding stage. In fact, this tremendous flow in Mississippi at St. Louis is still the largest flow on record for the last 150 years.
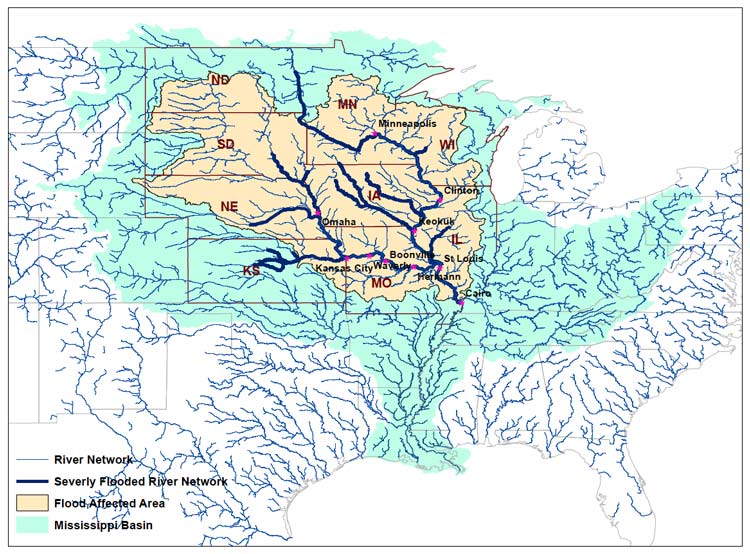
The most severe flooding was concentrated along a 500-mile stretch of the Mississippi River between Cairo, Illinois, and Minneapolis, Minnesota, and along a 400-mile length of the Missouri River from Omaha, Nebraska, to St. Louis, Missouri (see Figure 2). While as many as 500 streamflow gauge stations in the region exceeded flood stage, record flooding occurred at about 95 of them and, according to a USGS report, 45 exceeded the 100-year flow by mid-July. In many places along the Missouri River between Nebraska and St. Louis and from southern Iowa to St. Louis on the Mississippi River, water levels reached approximately 500-year return periods. While water levels in many rivers remained above flood stage for as long as five to six months, the record-breaking water levels in the Mississippi at St. Louis remained above the previous record for three straight weeks.
Levee Failure
There are three types of flood control systems for the Upper Mississippi River basin: flood control reservoirs, levees/floodwalls for urban areas, and levees. There were approximately 60 federal flood control reservoirs upstream of St. Louis and 226 federal and 1,345 non-federal levees in the Upper Mississippi River basin. Ninety-five percent of the levees (most of them privately built) were meant to protect croplands against relatively low recurrence interval floods of 10 to 50 years.
Levee breaks, which began in early July, were one of the most dramatic manifestations of the 1993 floods. During July and August, 17 major levees were breached and approximately 0.24 million acres were flooded along the Mississippi and Illinois rivers. The multiple levee failures in this period show a distinctive signature on the stage records at stations downstream. According to the U.S. Army Corps of Engineers, floodwaters overtopped or damaged 40 federal levees and 1,043 non-federal levees. Figure 3 shows the locations of levee breaches on the Mississippi and Missouri rivers.
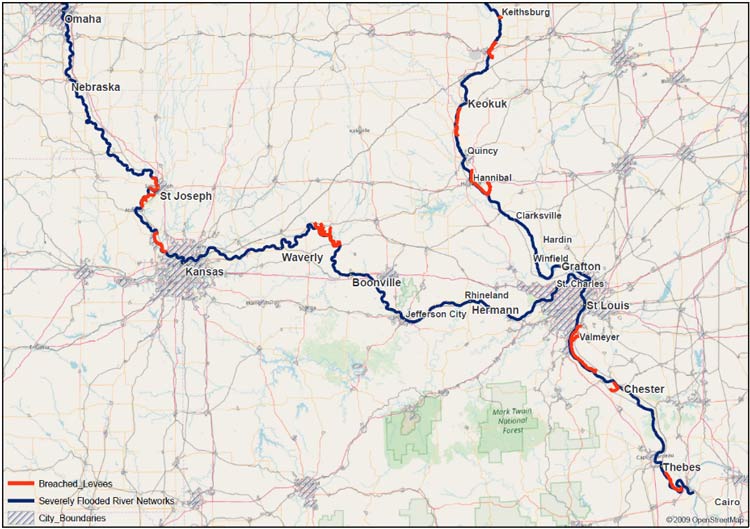
In addition to flooded croplands, the levee breaks resulted in widespread flooding in some urban areas. These include Hardin, IL, Rock Island, IL, Keithsburg, IL, Quincy, IL, Hannibal, MO, Clarksville, MO, Winfield, MO, Grafton, IL, Alton, IL, Chester, IL, Valmeyer, IL, Rhineland, MO, St. Joseph, MO, Boonville, MO, Jefferson City, MO, Hermann, MO, and St. Charles, MO. However, major cities such as St. Louis and Kansas City did not experience significant flooding because of their better levee protection systems.
Modeling the Great Flood of 1993
AIR modeled the 1993 event using the AIR Inland Flood Model for the United States; this event is a marquee event in the model’s historical catalog. AIR found that 48 gauges surpassed AIR’s modeled 100-year discharge, a finding that is similar to USGS’s report on the event, “Flood Discharges in the Upper Mississippi River Basin, 1993.” Figure 4 shows the hydrographs at four of these. The gauge station at Keokuk on the Mississippi River was significantly greater than the previous records of 1973 and 1851. The peak discharge at St. Louis on the Mississippi River was a record discharge, higher than the previous significant floods of 1844, 1903, and 1973. The peak discharge for the Missouri River at Boonville was also a record discharge, which exceeded the previous historic flood peak discharges in 1844, 1903, and 1951.
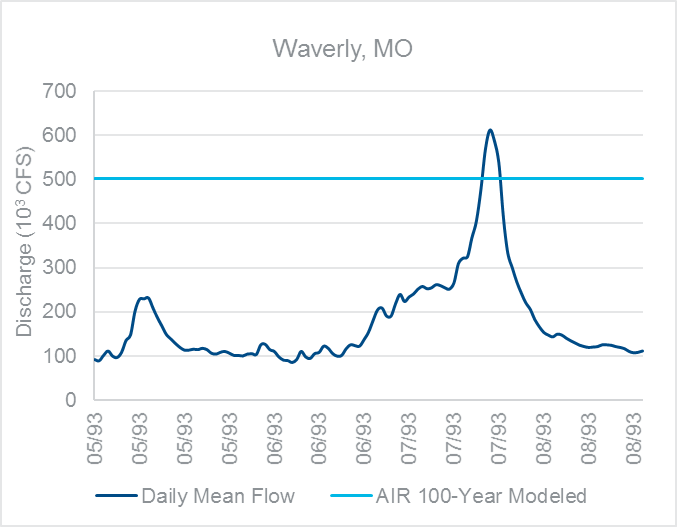
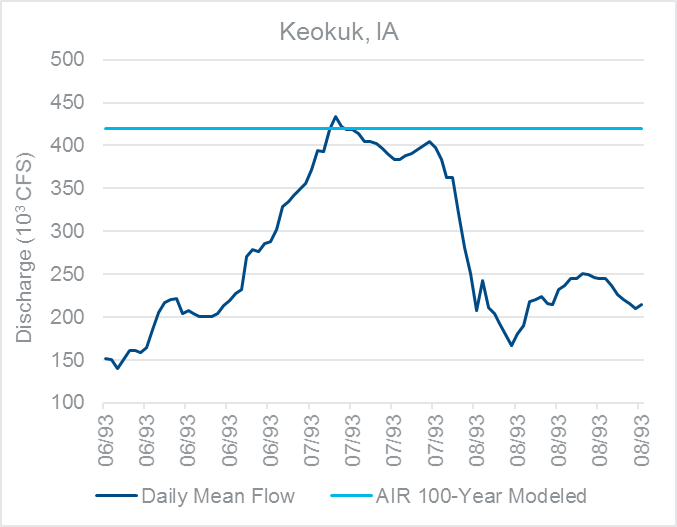
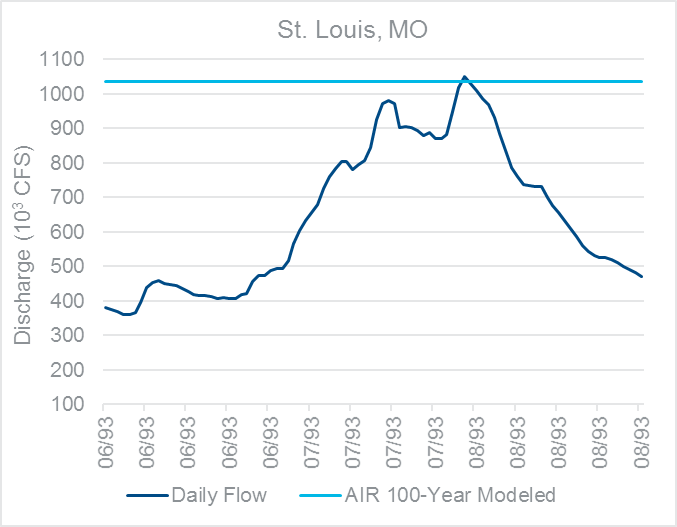
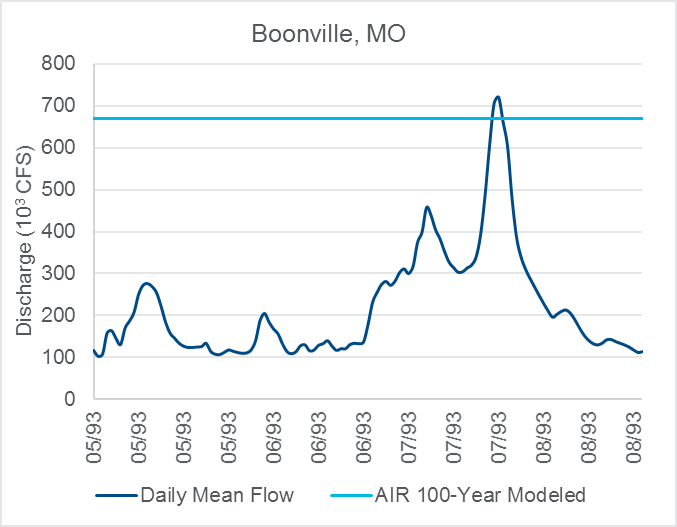
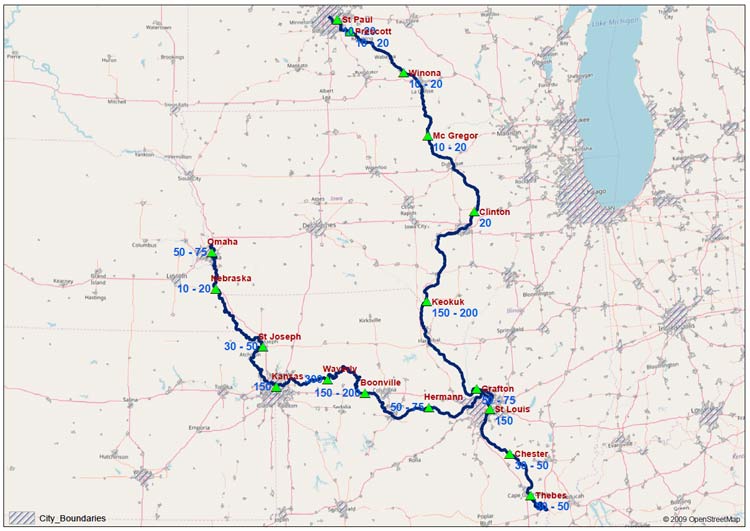
Figure 5 shows the modeled recurrence intervals for the recorded peak discharges at the available gauging stations on the Mississippi and Missouri rivers.
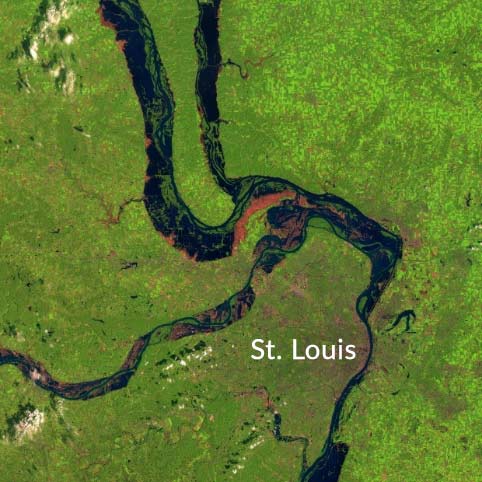
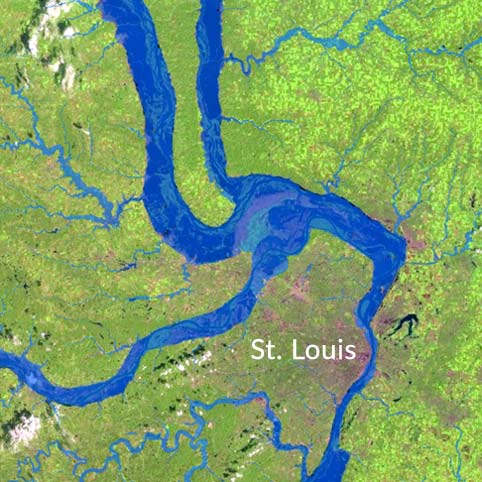
The modeled flows for all the rivers within the affected domain were used to generate the maximum flood extents. Overall, the modeled flood extent shows good agreement with the event footprint captured by NASA’s Landsat-5 Thematic Mapper at St. Louis, Missouri, on August 14, 1993 (Figure 6).
According to the AIR model, a recurrence of the 1993 event based on today’s exposures would result in insurable losses of more than USD 43 billion (a breakdown of losses by residential and commercial lines is shown in Figure 7). The worst affected state is Missouri, with nearly USD 19 billion in insurable loss, followed by Iowa, Kansas, and Illinois.
The Legacy
Because of the Great Flood of 1993, a significant amount of scientific research has been conducted on the impact of soil moisture on subsequent rainfall patterns that can develop. The event served as an important reminder of the interaction between the land surface and the atmosphere.
The event was also a turning point in the way that federal and state governments approached flood control. By the end of the event, 40 levees belonging to the federal government, and 1,043 levees belonging to state and local governments had failed, 50,000 homes were damaged, and 16,000 square miles of croplands were flooded. In total, the flood directly caused more than USD 15 billion in damage, although the total could have been much higher. The Army Corps of Engineers estimated that the intact flood control structures had prevented an additional USD 19 billion in damage.
After the flood, federal and local officials decided that trying to prevent this amount of damage from recurring would be a costly and unending process. As a result, a new era of flood control began; new flood control structures would only be built sparingly to protect critical areas. Since 1993, 28 square miles of floodplain around St. Louis have been protected by new or strengthened levees. Outside of these areas, the state and federal governments chose to offer buyouts to properties in the floodplain. In total more than 12,000 properties spread over nine states were bought out by FEMA. Agricultural land was purchased and set aside to provide space for floodwaters during future floods. This combination of “soft” and “hard” flood control has led to a reduction in losses in subsequent floods. Despite similar intensities, the 1995 and 2002 floods caused significantly less damage in riverside communities that were severely damaged in 1993.
The 1993 floods also highlighted the issue of underinsurance for the flood peril. FEMA approved 89,734 applications for the Disaster Housing Program and 38,423 applications for Individual and Family Grants, and the Small Business Administration (SBA) approved 20,285 loans for individuals and businesses. However, policyholders of the National Flood Insurance Program (NFIP) only filed 16,167 flood insurance claims. Many of those not eligible for insurance recoveries were outside of the 100-year floodplain, or were renters without flood insurance. The government realized that many of the recipients of grants and loans fared just as well as those receiving NFIP payouts. In 1994, changes were made to the flood and crop insurance programs to increase take-up and coverage and decrease the reliance on relief programs.
Flood is the United States’ most frequent and costly natural disaster, but one of the most poorly managed risks. Many of the lessons from the Great Flood of 1993—including the need to improve risk mapping and increase insurance take-up, the risk of floodplain development, and ecosystem management—remain substantial challenges. These same issues became all too apparent in Houston during Hurricane Harvey. Many meaningful changes across public and private sectors are still needed to improve resilience to the next catastrophic flood.
Managing U.S. Flood Risk
A robust catastrophe model accounts for all the complexities of the flood peril probabilistically; of particular importance for estimating flood occurrence losses is a model’s ability to accurately simulate individual storms or multiple storms in succession—especially high intensity systems that linger over a relatively larger area, as was the case with this 1993 system of storms. The AIR Inland Flood Model for the United States can model events like the Great Flood of 1993 as well as even more extreme precipitation events that can lead to even larger-scale disasters, such as those driven by levee failures along the Mississippi River or the recent flood events in Louisiana and Houston. As such, the model remains the best tool available for providing underwriters, risk managers, and other stakeholders with a comprehensive tool for assessing and managing inland flood risk and enabling all stakeholders to foresee the devastation that catastrophic events such as the Great Flood of 1993 can potentially result in.
 Srinivas Kondapalli
Manager, Flood Research
 Geetha Sakamuri
Senior Research Engineer
Edited by Nan Ma, CEEM
The article:
• Twenty-five years later, the Great Flood of 1993 remains one of the costliest floods in U.S. history.
• Levee breaks were one of the most dramatic manifestations of the 1993 flood.
• According to the AIR Inland Model for the United States, a recurrence of the 1993 flood based on today’s exposures would result in insurable losses of more than USD 43 billion.
• Flood is the United States’ most frequent and costly natural disaster, but one of the most poorly managed risks.
References
Charles Parrett (USGS Circular 1120-A), Flood Discharges in the Upper Mississippi River Basin, 1993
National Climate Data Center technical report - 93-04, The Summer of 1993: Flooding in the Midwest and Drought in the Southeast
NASA (April 6, 2006), Before and During the Great Mississippi Flood of 1993
James T.Lovelace (U.S. Army Corps of Engineers), The 1993 Mississippi River flood: An Engineer’s Perspective
Gary P. Johnson et.al., The Great flood of 1993 on the Upper Mississippi River – 10 years later
Sally McConkey et.al., (1994), 1993 Mississippi River Record Stages and Levee Failures Along the Illinois Border
Nani G. Bhowmik et.al., (1994 - Illinois State Water Survey Miscellaneous Publication 151), The 1993 Flood on the Mississippi River in Illinois
Mary P. Perlea et.al.,(1998), Repair of Scour Holes and Levees After the 1993 Flood
Gerald E. Galloway, Jr., Learning from the Mississippi Flood of 1993: Impacts, Management Issues and Areas of Research