The Geospatial Analytics Module in Touchstone: See Beyond the EP Curve
Catastrophe risk management has come a long way in its 25-year history, so we think it's time your analytics go beyond numbers on a spreadsheet. The Geospatial Analytics Module in Touchstone® lets you see the storm tracks, earthquake ground motion patterns, flood inundation footprints, and visualizations of other hazards that can put your exposures at risk.
But it's not just about pretty pictures. Unlike standard GIS applications, the award-winning visualization capabilities in Touchstone's Geospatial Analytics Module were engineered with the insurance industry in mind. The end result is fast, intuitive insight into what drives your risk—insight that goes far beyond the exceedance probability curve.
"Touchstone's geospatial analytics have proven to be instrumental in leveraging Axiom Re's services to our clients by adding valuable insight that has been cited in support of a favorable rating or upgrade.
Especially in the face of substantial cat losses, the need for best-in-class cat risk management is paramount, and Touchstone has added true strategic value to the effort."-Matthew D. Rose, CPCU, ARe
Executive Vice President, Axiom Re

Accumulate exposures—anywhere in the world
Tools for accumulation management have been a mainstay in catastrophe risk management for many years. For the first time, the Geospatial Analytics Module adds an essential layer of information that no other solution in the market can deliver.
Not only can you seamlessly integrate exposure information with location-specific hazard data, but you can also leverage the power of Touchstone's financial module to apply policy and layer terms to run geospatial analyses based on your exposed limits.
A full range of loss perspectives are available—including ground-up, gross, pre-cat excess of loss, and post-cat net. And users can specify accumulations by geopolitical boundaries, user-defined territories, intensity bands from real or simulated events, or concentric rings.

Manage non-modeled risk
Flooding in Brazil, volcanic eruptions in Iceland, a terrorist attack in Indonesia. Non-modeled sources of potential loss can easily be managed within a single platform. By importing event footprints or hazard maps and applying user-specified damage ratios, policy terms, and reinsurance programs, you can get a customized view of potential losses in non-modeled regions and for non-modeled perils.
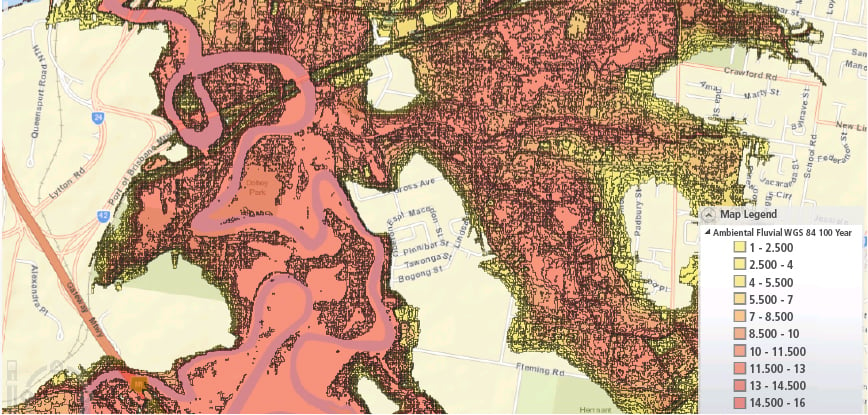
Integrate third-party data on a flexible, open platform
Touchstone's open architecture allows for the seamless integration of third-party hazard data and models. Data providers that have already signed agreements with AIR include Ambiental (whose map is shown above), ERN, IHS Inc., KatRisk, Met Office, PERILS, and SSBN.
Many freely available third-party hazard layers are also available to import into Touchstone, including:
- Avalanche, flood, and earthquake hazard maps from Cartorisque
- Volcano data from the Smithsonian, USGS, and the National Research Institute for Earth Science and Disaster Prevention of Japan
- Return period ground motion hazard maps from the Global Earthquake Model
Develop real-time response strategies
Because there's no time like the present. As a hurricane approaches, in the aftermath of an earthquake, or in the days after a levee breach, plan clear and defensible loss mitigation and claims adjustment strategies in response to actual catastrophes. Import an event footprint (provided by AIR's ALERT™ service or a third-party source) to see what's at stake, and go from there.
The possibilities are limitless
The Geospatial Analytics Module is built on advanced mapping technologies and is seamlessly integrated with AIR's financial module. But what drives it is your intuition, and how you use it is up to you. Get answers to questions that are unique to your business and make better informed decisions based on a fuller view of your risk.