Touchstone® 3.0
You asked, we delivered.
Significant workflow improvements. The ability to compare results of different loss analyses. Access to location-level event intensity information. It's more of what you need to truly own your risk.

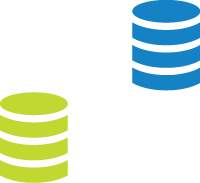
Exchange data seamlessly
Exchanging exposure and loss data between cedants, brokers, and reinsurers has never been easier. Our new automated "wizard" helps you manage reinsurance submissions by streamlining the process of importing and exporting data and intelligently packaging all the files required for analysis. Not only that, projects and exposure views are automatically created on import. The overall result will be a more efficient workflow so you can focus on what matters.
Side-by-side comparisons
When it comes to tracking the risk profile and capital adequacy of your portfolio, comparative analytics is essential. Instantly compare multiple analyses side by side. See how your current portfolio losses stack up with those from previous periods. Compare loss results when your exposure has changed, between model versions, using different financial terms or analysis options, or between geographical resolutions. Export the comparisons to quickly provide valuable insights to all stakeholders.

Greater transparency
You want deeper insight into model assumptions to further develop your view of risk. Now you can access and analyze location-level event hazard data—including wind speed and duration, ground motion, and storm surge depth—to understand events that are driving your risk. Use the information to help your organization meet regulatory requirements, including Solvency II. Or validate the modeled local intensity for historical events with intensity information provided by other meteorological or seismological organizations. It's up to you.
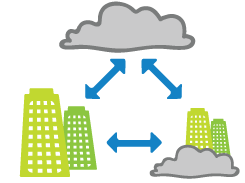
One size doesn't fit all
No two businesses are alike. So why take a "cookie-cutter" approach to support your unique business model? AIR offers flexibility, support, and scalability, whether you want to maintain resources in house or explore cloud solutions—or a combination of both. Now, you can take advantage of the resources available in Microsoft© Azure® to burst to the cloud during periods of peak demand, such as renewals. You can configure cloud bursting by user role, job type, or business unit to reflect your own priorities.
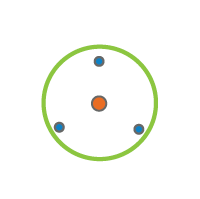
Powerful visualization, accurate results
Gain insight into what drives your risk—insight that goes beyond the exceedance probability curve. Our new dynamic ring analysis identifies the ring encompassing the highest accumulations. Unlike grid or location-based analysis, which can miss the point of maximum exposure, you'll obtain more accurate results.
Architected for flexibility
After all, it's your view of risk. Now, there are even more ways for you to test and adjust your modeled losses. Modify event-level losses by event intensity, construction, occupancy, year-built, or height. To explore even further, you can integrate non-AIR models such as ERN's earthquake and hydro models for Mexico directly into Touchstone. Seamlessly manage multiple models and catalogs to create a comprehensive view of risk—all in one platform.